Exploring Analytical Adoption in Portuguese SMEs: This study delves into the adoption of analytics by small and medium-sized enterprises (SMEs) in Portugal, surveying 58 participants on 58 different companies how analytics tools influence the performance and optimization of their purchasing decisions.
The purpose of this research study is to investigate how the use of Business Intelligence (BI) using analytical systems, can support Small and Medium-sized Enterprises (SMEs) in the Portuguese retail sector with their purchasing activities in the supply chain. Companies analyze various sources of data to manage their daily operations while also improving their performance and finding new ways to generate business. However, recent studies have shown that SMEs are slow to adopt BI and data analytics strategies. Extensive studies on BI usage are often related to large corporations and may not necessarily apply to SMEs. This study conducted an online survey based on performance in the retail sector in line with the Supply Chain Operations Reference (SCOR) model, which is universally accepted as a guide for measuring performance outcomes in the supply chain.
The primary goal of this research is to analyze which are the aspects to consider in the use of systems that assist SMEs in purchasing the quantities they need for existing demand. With these aspects, this study can guide these types of companies in taking the first steps towards understanding how to implement BI systems in their organisations. It also seeks to focus on the current experiences of the respondents regarding the current use of BI and data analytics in their organization to understand current practices in decision-making related to purchasing and how the use of analytical systems has created value in their organization.
Data aggregation, analysis, and presentation can be seen as essential to an organization, to its supply chain, and to its sustainability. As a smart data processing tool, BI offers one of the best current solutions to address the challenge of information overload and assist users in making better business decisions through data utilization and visualization.
Multiple Regression Analysis
A multiple regression analysis was performed using Microsoft Excel to investigate how different respondents perceive the use of analytical tools as a critical success factor for their companies. This analysis included four independent variables to identify which ones are most strongly associated with being considered critical for success.
| Independent Variable | Coefficient | Standard Error | P value | Lower 95% |
|---|---|---|---|---|
| Influence all the organization | 0,429 | 0,160 | 0,02 | 0,08 |
| Gives support to business strategy | 0,226 | 0,206 | 0,29 | – 0,22 |
| Improves some aspects in processes | 0,090 | 0,331 | 0,79 | – 0,63 |
| Improved maintaining operations without much impact | 0,260 | 0,246 | 0,31 | – 0,28 |
| Regression | Significance F |
| 0,01 |
| R Square | 0,63 |
According to Table 2, the model is considered statistically significant. The F-test assesses whether the regression model as a whole is statistically significant. A significance value (p-value) lower than 0.05 (or a pre-determined significance level) indicates that at least one of the independent variables has a significant effect on the dependent variable. The R-squared value represents the degree to which the dependent variable depends on the model’s independent variables. In this case, it depends 63%. The p-value of the independent variables tests the null hypothesis that the coefficient of each independent variable is zero, indicating that the independent variable has no effect on the dependent variable. The smaller the p-value (generally below 0.05), the stronger the evidence against the null hypothesis, indicating that the independent variable has a significant effect on the dependent variable. The closer it approaches 0, the more it can influence the determination of a critical success factor. The value closest to 0 and therefore most influential in determining as a critical success factor is the use of BI influencing the entire organization. If the use of BI and its tools can influence the entire organization, the likelihood of it being seen as a success factor increases.
Other data
Another relevant and curious data that this research brought out was the percentage of use of business analytics data. Here is the graph:
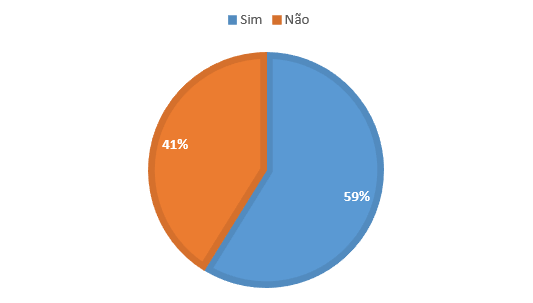
41% of the respondents have not adopted any business analytics technology, underscoring the significance of this research in assisting SMEs in Portugal. This study is pivotal in guiding these businesses towards innovation and process optimization.
Thank you for your reading.