

| # | As a | I want (Request) | So that I (User Value) | Acceptance Criteria |
| 1 | Sales Manager | To get a dashboard overview of internet sales | Can follow better which customers and products sells the best | A Power BI dashboard which updates data once a day |
| 2 | Sales Representative | A detailed overview of Internet Sales per Products | Can follow up my Products that sells the most | A Power BI dashboard which allows me to filter data for each Product |
| 3 | Sales Representative | A dashboard overview of internet sales | Follow sales over time against budget | A Power Bi dashboard with graphs and KPIs comparing against budget |
To create the necessary data model for doing analysis and fulfilling the business needs defined in the user stories the following tables were extracted using SQL.
One data source (sales budgets) were provided in Excel format and were connected in the data model in a later step of the process.
Below are the SQL statements for cleansing and transforming necessary data.
DIM_Calendar:
SELECT [DateKey] ,
       [FullDateAlternateKey] AS Date ,
       --[DayNumberOfWeek] ,
       [EnglishDayNameOfWeek] AS Day ,
       --[SpanishDayNameOfWeek] ,
       --[FrenchDayNameOfWeek] ,
       --[DayNumberOfMonth] ,
       --[DayNumberOfYear] ,
       [WeekNumberOfYear] AS WeekNr ,
       LEFT([EnglishMonthName],3) AS Month ,
       --[SpanishMonthName] ,
       --[FrenchMonthName] ,
       [MonthNumberOfYear] AS MonthNo ,
       [CalendarQuarter] AS Quarter,
       [CalendarYear] AS Year
       --[CalendarSemester] ,
       --[FiscalQuarter] ,
       --[FiscalYear] ,
       --[FiscalSemester]
FROM [AdventureWorksDW2022].[dbo].[DimDate]
WHERE CalendarYear >= 2022
In this code I extracted the information after 2022. Formatted some namings and select the right data according to the problem statement.
DIM_Customers:
SELECT
  [CustomerKey],
  --[GeographyKey] ,
  --[CustomerAlternateKey] ,
  --[Title] ,
  [FirstName] AS [First Name],
  --[MiddleName] ,
  [LastName] AS [Last Name],
  FirstName + ' ' + LastName AS [Full Name],
  --[NameStyle] ,
  --[BirthDate] ,
  --[MaritalStatus] ,
  --[Suffix] ,
  CASE Gender WHEN 'M' THEN 'Male' WHEN 'F' THEN 'Female' END AS Gender,
  --[EmailAddress] ,
  --[YearlyIncome] ,
  --[TotalChildren] ,
  --[NumberChildrenAtHome] ,
  --[EnglishEducation] ,
  --[SpanishEducation] ,
  --[FrenchEducation] ,
  --[EnglishOccupation] ,
  --[SpanishOccupation] ,
  --[FrenchOccupation] ,
  --[HouseOwnerFlag] ,
  --[NumberCarsOwned] ,
  --[AddressLine1] ,
  --[AddressLine2] ,
  --[Phone] ,
  [DateFirstPurchase],
  g.City AS [Customer City]
  --[CommuteDistance]
FROM
  [AdventureWorksDW2022].[dbo].[DimCustomer] AS c
  LEFT JOIN dbo.DimGeography AS g ON g.GeographyKey = c.GeographyKey  -- Joined Cities with GeographyKey
ORDER BY
	CustomerKey ASC
In this SQL code I formatted the gender as an abbreviation and joined First Name and Last Name to give the Full Name.
Also joined the geography key so we can display the costumer city on a map in the dashboards.
DIM_Products:
SELECT
  p.[ProductKey],
  p.[ProductAlternateKey] AS ProductItemCode,
  --[ProductSubcategoryKey],
  --[WeightUnitMeasureCode],
  --[SizeUnitMeasureCode],
  p.[EnglishProductName] AS [Product Name],
  ISNULL(ps.EnglishProductSubcategoryName, 'No Sub Category') AS [Sub Category],
  ISNULL(pc.EnglishProductCategoryName, 'No Category') AS [Product Category],
  --[SpanishProductName],
  --[FrenchProductName],
  --[StandardCost],
  --[FinishedGoodsFlag],
  p.[Color] AS [Product Color],
  --[SafetyStockLevel],
  --[ReorderPoint],
  --[ListPrice],
  ISNULL(p.[Size], 'No Size') AS [Porduct Size],
  --[SizeRange],
  --[Weight],
  --[DaysToManufacture],
  ISNULL(p.[ProductLine], 'NA') AS [Product Line],
  --[DealerPrice],
  --[Class],
  --[Style],
  ISNULL(p.[ModelName], 'NA') AS [Product Model Name],
  --[LargePhoto],
  ISNULL(p.[EnglishDescription], 'NA') AS [Product Description],
  --[FrenchDescription],
  --[ChineseDescription],
  --[ArabicDescription],
  --[HebrewDescription],
  --[ThaiDescription],
  --[GermanDescription],
  --[JapaneseDescription],
  --[TurkishDescription],
  --[StartDate],
  --[EndDate],
  ISNULL ([Status], 'Outdated') AS [Product Status]
FROM
  [AdventureWorksDW2022].[dbo].[DimProduct] as p
  LEFT JOIN dbo.DimProductSubcategory AS ps ON ps.ProductSubcategoryKey = p.ProductSubcategoryKey
  LEFT JOIN dbo.DimProductCategory AS pc ON ps.ProductCategoryKey = pc.ProductCategoryKey
ORDER BY
	p.ProductKey ASC
Here somre products that add NULL values were set as a default value so they aren’t displayed on the dashboards as NULL.
FACT_InternetSales:
-- Cleansed FACT_InternetSales Table --
SELECT
  [ProductKey],
  [OrderDateKey],
  [DueDateKey],
  [ShipDateKey],
  [CustomerKey],
  --  ,[PromotionKey]
  --  ,[CurrencyKey]
  --  ,[SalesTerritoryKey]
  [SalesOrderNumber],
  --  [SalesOrderLineNumber],
  --  ,[RevisionNumber]
  --  ,[OrderQuantity],
  --  ,[UnitPrice],
  --  ,[ExtendedAmount]
  --  ,[UnitPriceDiscountPct]
  --  ,[DiscountAmount]
  --  ,[ProductStandardCost]
  --  ,[TotalProductCost]
  [SalesAmount] --  ,[TaxAmt]
  --  ,[Freight]
  --  ,[CarrierTrackingNumber]
  --  ,[CustomerPONumber]
  --  ,[OrderDate]
  --  ,[DueDate]
  --  ,[ShipDate]
FROM
  [AdventureWorksDW2019].[dbo].[FactInternetSales]
WHERE
  LEFT (OrderDateKey, 4) >= YEAR(GETDATE()) -2 -- Ensures we always only bring two years of date from extraction.
ORDER BY
  OrderDateKey ASC
In this SQL statement we only want the two years from now, so we ensure to show only the minus 2 year from GETDATE funtion.
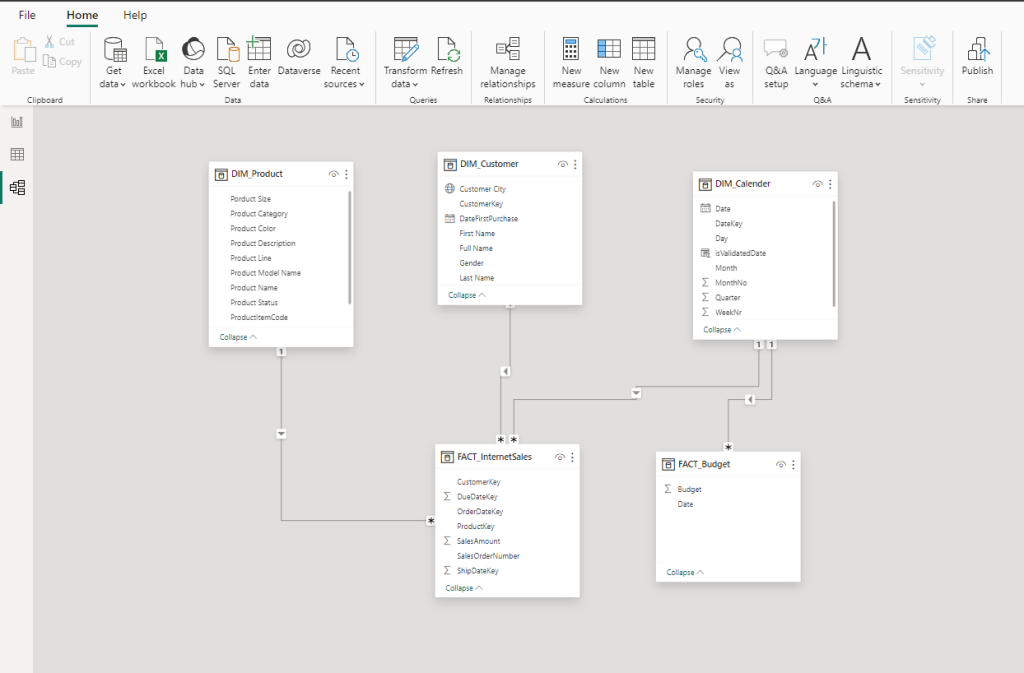
Below is a screenshot of the data model after cleansed and prepared tables were read into Power BI.
This data model also shows how FACT_Budget hsa been connected to FACT_InternetSales and other necessary DIM tables.
The finished sales management dashboard with one page with works as a dashboard and overview, with two other pages focused on combining tables for necessary details and visualizations to show sales over time, per customers and per products.
Click the picture to to open the dashboard and try it out!
In order to watch the Power BI dashboards you need to login.
Thank your for watching 🙂