This SQL query is designed to retrieve and present specific financial information about German companies from two tables in your database. Here’s a breakdown of what each part of the query does:
SELECTClause: This is the part of the query that specifies the columns to be displayed in the final result. The columns included are:t1.Name: The name of the company.CAST(t2.revenue_eur AS FLOAT) AS Revenue_EUR: The revenue in euros, converted to a float type.CAST(t1.market_cap_eur AS FLOAT) AS Market_Cap_EUR: The market capitalization in euros, converted to a float type.CAST(t2.revenue_usd AS FLOAT) AS Revenue_USD: The revenue in USD, converted to a float type.CAST(t1.market_cap_usd AS FLOAT) AS Market_Cap_USD: The market capitalization in USD, converted to a float type.ROUND(CAST(t2.revenue_eur AS FLOAT) / NULLIF(CAST(t1.market_cap_eur AS FLOAT), 0), 2) AS RATIO_EUR: A calculated ratio of revenue to market cap in euros, rounded to two decimal places. TheNULLIFfunction is used to avoid division by zero.ROUND(CAST(t2.revenue_usd AS FLOAT) / NULLIF(CAST(t1.market_cap_usd AS FLOAT), 0), 2) AS RATIO_USD: A similar ratio as above, but for USD.t2.Headquarters AS HQ: The location of the company’s headquarters.t2.Industry: The industry in which the company operates.
FROMClause: This specifies the source tables of the data.[filipedb].[dbo].[companies_marketcap] AS t1: Refers to a table containing market capitalization data, aliased ast1.[filipedb].[dbo].[companies_revenue] AS t2: Refers to a table containing revenue data, aliased ast2.
JOINClause: This part of the query combines the two tablest1andt2based on a common column.ON t1.NAME = t2.NAME: This condition specifies that the join should be made where theNAMEcolumn in tablet1matches theNAMEcolumn in tablet2. Essentially, it pairs the market cap and revenue data for the same company.
In summary, this query joins two tables, companies_marketcap and companies_revenue, based on the company name.
It then selects and processes certain financial data, including revenue and market cap in both EUR and USD, along with calculated ratio, and information about the headquarters and industry of each company. The result is a comprehensive dataset that combines your web-scraped data into a meaningful format for analysis.
SELECT
    t1.Name,
    CAST(t2.revenue_eur AS FLOAT) AS Revenue_EUR,
    CAST(t1.market_cap_eur AS FLOAT) AS Market_Cap_EUR,
    CAST(t2.revenue_usd AS FLOAT) AS Revenue_USD,
    CAST(t1.market_cap_usd AS FLOAT) AS Market_Cap_USD,
    ROUND(CAST(t2.revenue_eur AS FLOAT) / NULLIF(CAST(t1.market_cap_eur AS FLOAT), 0), 2) AS RATIO,
    t2.Headquarters AS HQ,
    t2.Industry
FROM
    [filipedb].[dbo].[companies_marketcap] AS t1
    JOIN [filipedb].[dbo].[companies_revenue] AS t2 ON t1.NAME = t2.NAME
ORDER BY RATIO DESC;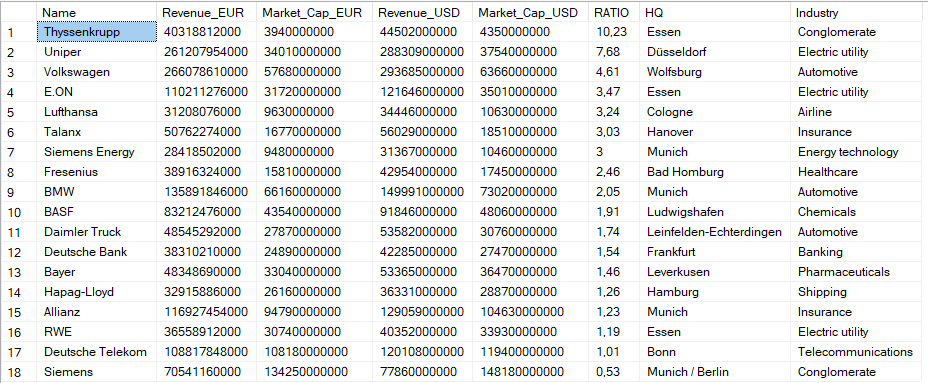
References
List of largest German companies – https://en.wikipedia.org/wiki/List_of_largest_German_companies
Exchange Rates API – https://www.exchangerate-api.com/
Companies by Market Cap – https://companiesmarketcap.com/germany/largest-companies-in-germany-by-market-cap/
Revenue definition – https://www.investopedia.com/ask/answers/122214/what-difference-between-revenue-and-income.asp
Market Cap definition – https://www.fidelity.com/learning-center/trading-investing/fundamental-analysis/understanding-market-capitalization
Thank you for reading this project 🙂